
Defined Contribution (DC) costs and charges for UKRF members
The Trustee has prepared illustrations of the cumulative impact of costs and charges on the assumed investment performance for a range of UKRF DC funds. Along with these illustrations, the Trustee has also provided information on how they have assessed the value for members provided by the UKRF, how the default investment funds offered to members are designed and governed, and information on the costs of investing in each fund. Members of the UKRF can view previous versions of this information by accessing archived versions of the Trustee Report and Accounts which are available on the member pages of ePA.

In line with pension regulations, the Trustee arranges for an independent value for members assessment to be carried out each year of whether the DC funds of the UKRF offer value for its members. The Trustee was pleased to note that this independent assessment reported that the UKRF offers excellent value for its DC members.

The Trustee regularly reviews the design of the UKRF’s default investment funds and their investment objectives. A triennial review of the UKRF Lifestyle Fund range was concluded in 2023.
The Trustee has collated details of the investment manager charges and transaction costs, as defined by regulations, for each of the UKRF’s DC investment funds. This includes a description of what these charges and costs comprise and a list of the charges and costs for each of the UKRF’s investment funds for the year to 30 September 2024.
DC members of the UKRF do not pay towards the administration costs of the UKRF and therefore it is only these investment costs which are deducted from members’ funds.
The Trustee has produced a set of illustration tables to show the possible impact that investment costs and charges may have on members’ retirement savings. These illustrations have been produced in line with the latest guidance from the Department for Work and Pensions.
The Trustee recommends that members look at how to read the illustration tables before reviewing the illustrations.
The illustrations broadly represent the UKRF’s DC membership when considering age, current retirement savings amounts, the funds members have chosen to invest in and the different charges involved.
Annualised returns over 1, 3 and 5 years to 30 September 2024, net of transaction costs and charges, are provided for all of the investment options available to members of the UKRF. The assets held by the UKRF Lifestyle Fund range are shown as at 30 September 2024.
How to read the illustration tables
It is important to note that the illustration tables are designed to show the potential impact of costs and charges on investment returns. All of the illustrations assume a growth rate for each type of investment fund that is applied at the same rate for each year of the illustration. In reality the value of investments and the returns they generate are not guaranteed and can go down as well as up and this risk to members' retirement savings is not reflected in these illustrations.
The illustrations also assume the investment charges and transaction costs remain the same and are deducted each year. In reality the costs and charges will fluctuate each year.
The illustrations are not designed to provide UKRF members with a personalised projection of what their benefits may be worth at retirement. DC members of the UKRF should review their latest benefit statement which is available on the member pages of ePA.
The diagrams below show you how to read the tables.
It is important to note that these illustrations are designed to show the potential impact of costs and charges on investment returns. The illustrations are not designed to provide members with a personalised projection of what their benefits may be worth at retirement. All illustrations assume a growth rate for each type of investment fund that is applied at the same rate for each year of the illustration. The value of investments and the returns they generate are not guaranteed and can go down as well as up and this risk to members’ retirement savings is not reflected in these illustrations.
Members of the UKRF can check where the UKRF's DC funds are invested and their performance on the member pages of ePA.
Following consultation with Barclays Bank PLC, the Trustee has agreed a statement of investment principles for the UKRF that sets out how the Trustee invests.
Value for members assessment
The Trustee assesses, at least annually, whether the DC elements of the UKRF deliver value for members. In the Trustee’s view, charges and transaction costs are likely to represent good value for members where the combination of member-borne costs and what is provided for the costs is appropriate for the membership as a whole, and when compared to other options available in the market.
The Trustee has engaged Barnett Waddingham, a specialist DC consultant, to advise the Trustee on DC governance matters and in particular to carry out an independent value for members assessment in line with the General Code and guidance issued by The Pensions Regulator (TPR).
The Trustee is required to assess annually the extent to which the charges, performance based fees and transaction costs borne by members represent good value. In December 2024 the Trustee received the independent value for members assessment covering the year to 30 September 2024 and was pleased to confirm again that the UKRF continues to offer excellent value for its members, given the range, quality and nature of the services provided. The key reasons for this conclusion include the robust governance processes and that members only pay the investment costs of the funds in which they are invested, which are very competitive when compared to other schemes of this nature. All other running costs are paid for by the UKRF.
Recognising that low cost does not necessarily mean good value, the assessment also considered the value for members delivered by the UKRF’s DC investment arrangements, i.e. those services for which the costs and charges detailed in this statement are deducted from members’ funds. All relevant aspects of the UKRF’s investments were reviewed, including the governance structure, design and monitoring arrangements. Consideration was also made of the member-borne costs relative to other options in the market. The assessment reported no areas in which the DC investment arrangements detracted value.
In addition, the Trustee believes that the transaction costs detailed in this statement provide good value for members, as the ability for the investment managers to transact forms an integral part of the investment process, and gives potential for greater investment returns net of charges over time. The Trustee continues to monitor the levels of transaction costs.
Over the reporting period, it was identified that some of the of the benefits held for certain members investing in the UKRF’s AVC policies do not fall under the definition of an AVC. The Trustee has worked with its professional advisers to understand the implications of this and has implemented measures to ensure that these benefits are subject to the correct governance and reporting requirements. Going forwards, the Trustee will refer to these benefits as external ‘With-profit’ policies rather than AVC policies, to more accurately reflect the nature of benefits held. This has been reflected in this Statement.
In line with previous years, the Trustee has undertaken a proportionate annual assessment of the value for members offered by these external With-profit policies and is confident that they continue to offer reasonable value to members and does not expect the value for members to change. The key reasons for this conclusion remain that by investing in With-profit policies members have benefited from a capital guarantee and positive investment returns in recent years, despite higher levels of fees, and their funds are invested with major insurance companies with open books of business.
In 2021, the Trustee reviewed the type and level of protection for members’ investments held by the UKRF and concluded that there are appropriate protections and segregation of assets in place. In carrying out this review the Trustee considered:
- The legal structure of each fund to understand the protections in place in the event of insolvency of either the investment manager or custodian;
- The levels of indemnity insurance in place at the investment managers and custodian; and
- The rules of the Financial Services Compensation Scheme (FSCS) to understand which of the UKRF’s DC investment funds may be able to make a claim on the FSCS.
The Trustee will continue to monitor the type and level of protection of assets across the UKRF’s investment fund range. In the event that any changes are made to the UKRF fund range in future, the Trustee will consider and determine if a further review of these protections is required.
Back to top
The Defined Contribution default investment funds
Members who did not make an active investment decision on joining the UKRF had their contributions invested in the UKRF Lifestyle Fund ranges, which are series of funds that offer members flexibility to target the year in which they expect to access their retirement savings, which for most members will be age 60. These were the “default investment funds” for the UKRF over the reporting period. The Trustee has also made available a range of other DC investment options that members can choose to invest in (known as the self-select range).
The Trustee is responsible for the UKRF’s investment governance. This includes setting the investment objective for the default investment funds, which considers the needs of the membership in conjunction with the Trustee’s investment objectives. The Trustee concluded the last triennial review of the UKRF Lifestyle Fund ranges in 2023 which covered:
- A review of both the strategy and the performance of the default investment funds, and the extent to which the return on the investments (after deduction of investment charges) was consistent with the Trustee’s aims and objectives for the default funds;
- An assessment of the appropriateness of the lifestyle glide path, and its target endpoint portfolio, utilised in the default investment funds. This assessment included consideration of the ways members are choosing to access their benefits at retirement;
- An assessment of the performance of each investment option available through the self-select range; and
- A review of the membership profile including consideration of the number and risk profile of investment funds offered to members as an alternative to the default investment funds.
The review confirmed that the default investment funds remain appropriate as they are likely to provide good member outcomes at retirement. The next triennial review is scheduled to commence in 2025.
There are two UKRF Lifestyle Fund ranges in place, both of which are classed as default investment funds.
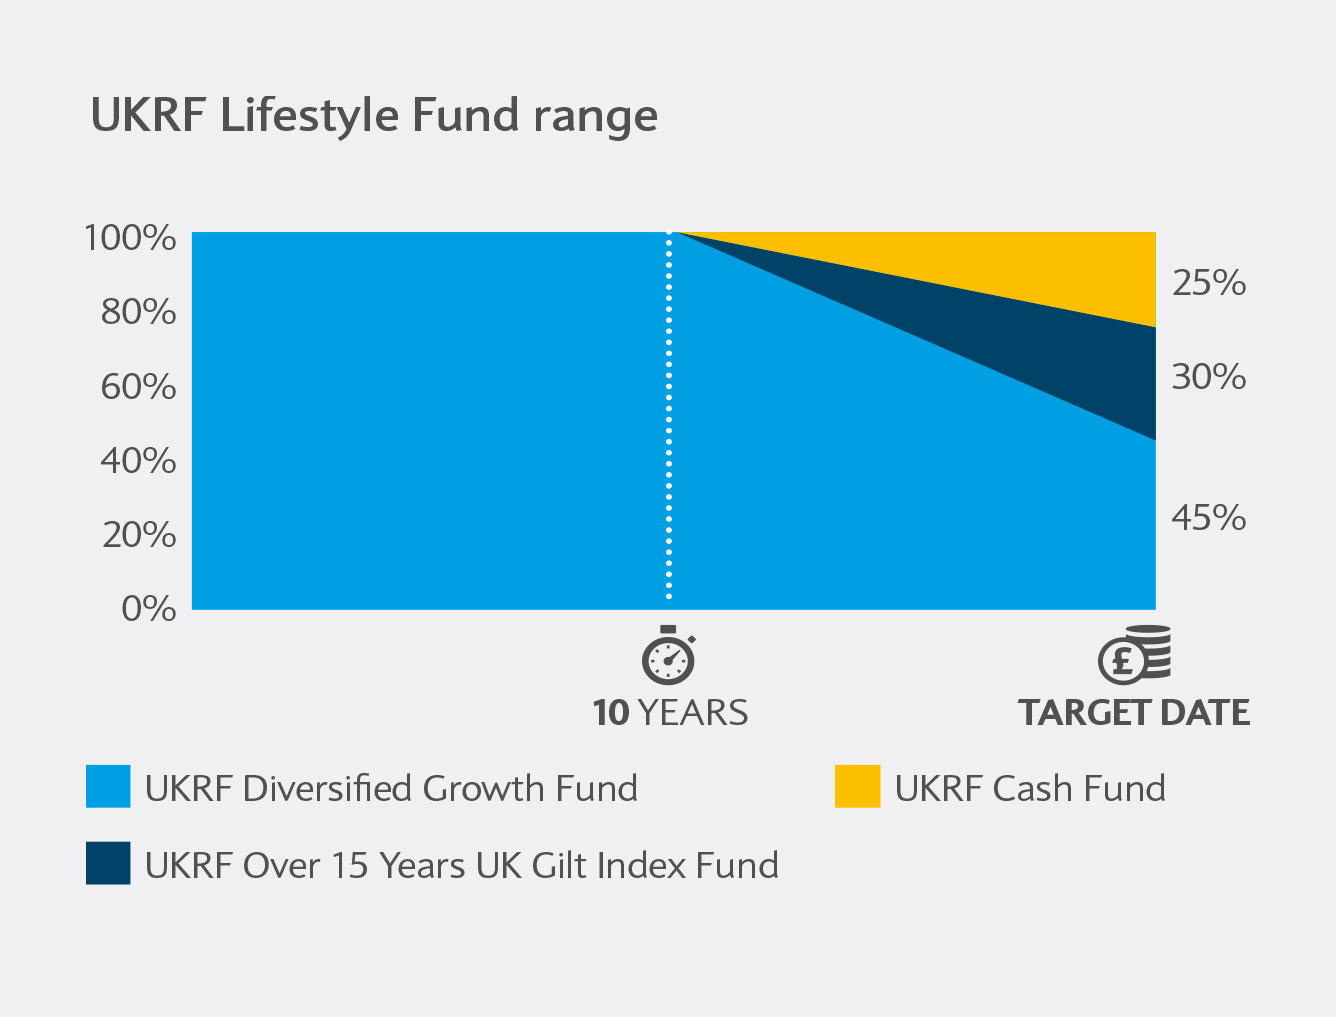
- The UKRF Lifestyle Fund range – This default investment fund was launched in February 2017 and is open to all members. Members many years from retirement are invested in a diversified mixture of assets, with the aim of generating capital growth ahead of inflation over the long term. When members are 10 years from their target retirement date, increasing levels of capital and retirement income protection assets are introduced (this is known as the glide path). Members at and beyond their target retirement date are invested in the UKRF Lifestyle Mature Fund, comprising a range of investments with the aim of being broadly aligned to the wider range of options now available when accessing retirement savings.
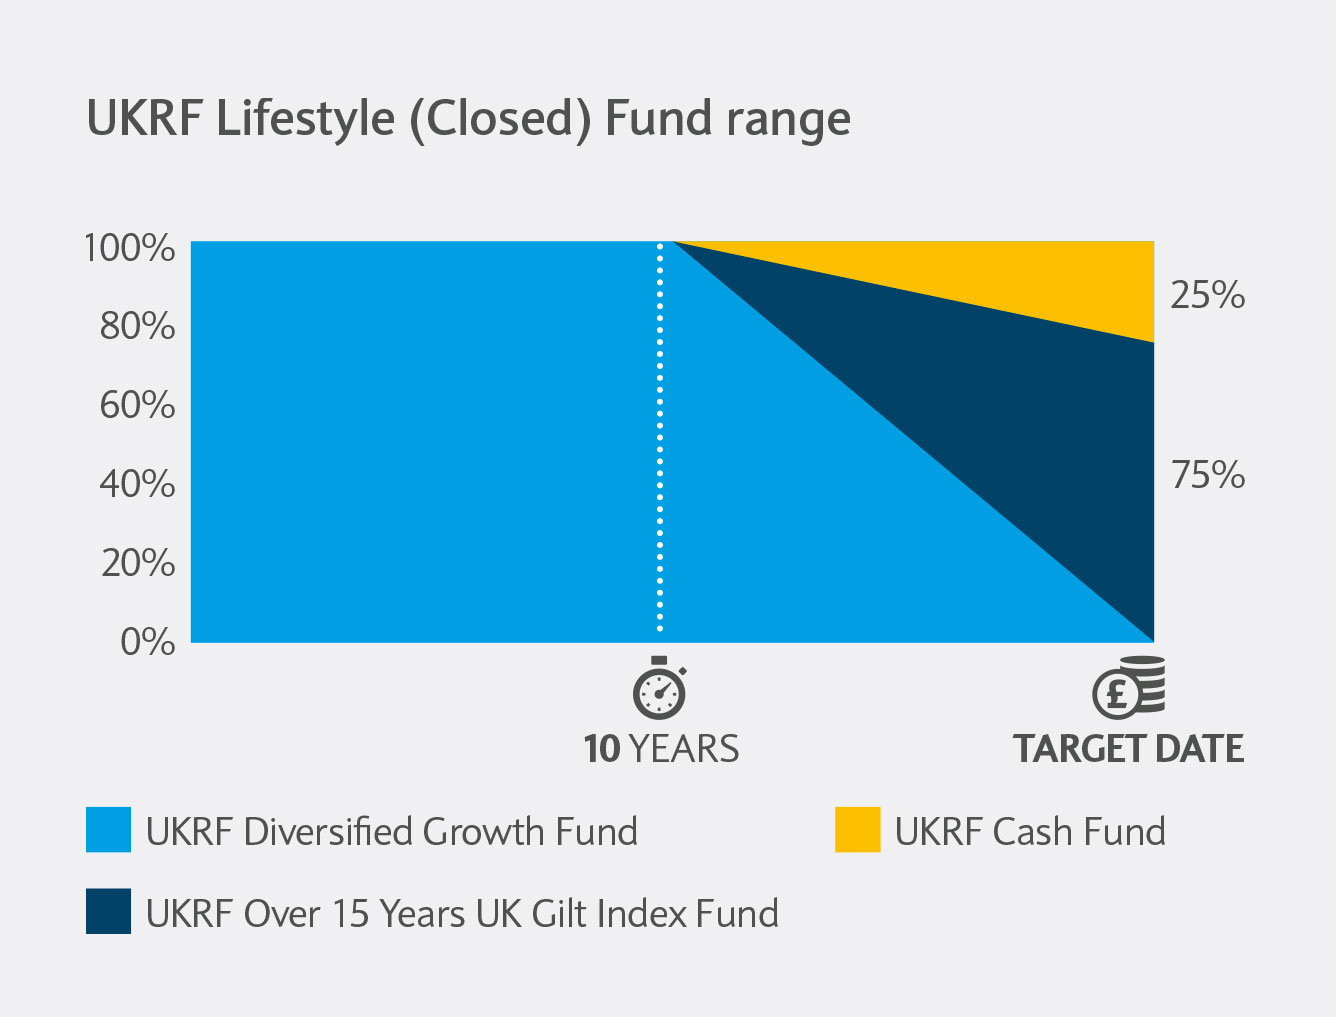
- The UKRF Lifestyle (Closed) Fund – Members at and beyond their target retirement date are invested predominantly in government bonds and cash with the aim of providing a broad compromise between capital protection and tracking movements in annuity prices. This fund range is only comprised of the UKRF Lifestyle (Closed) Mature Fund.
Investments in the UKRF Lifestyle Fund ranges are made through index-tracking funds, derivatives or segregated assets.
Statement of Investment Principles (SIP)
The Trustee has a SIP which governs its decisions about default investment funds (as well as the other DC investment options). The SIP is reviewed following any material changes to the investment strategy of the Fund and no less frequently than every three years. The SIP was last updated in October 2024.
A copy of the UKRF’s SIP is available here. The SIP includes the Trustee’s policy on the types of investments it considers appropriate and how it recognises and monitors investment risk. The SIP covers the:
- Trustee’s investment responsibilities;
- Investment objectives of the UKRF;
- Investment strategy of the UKRF, including the expected return on investments;
- Investment risks involved and the Trustee’s methods for managing these;
- Trustee’s policy in relation to how it takes environmental, social and governance (ESG) factors into consideration and the stewardship of investments; and
- Other relevant investment policies including the Trustee’s policy on the use of derivatives and employer related investments.
The Trustee has reviewed the performance of all of the DC investment options, including the default investment funds, on a quarterly basis and is satisfied that the long term performance is in line with the aims and objectives of each fund. A summary of the investment returns for each of the available DC investment options, along with fund factsheets and an investment guide (which provides more detail on the default investment funds and glide path), can be found on the member website.
Back to top
Charges and transaction costs
The Trustee assessed the charges and transaction costs borne by members over the reporting period, for each of the investment funds in which members are invested, and has considered the extent to which the services these charges and costs relate to deliver value for members. The Trustee monitors the charges and transaction costs, to the extent updated information is available, on a regular basis.
DC investment funds available within the UKRF
The table below shows the total expense ratio and transaction costs for each investment fund available to members of the UKRF:
- Total expense ratio – This is the charge levied by the investment manager each year and is a measure of the provider’s total costs for managing and operating the investment fund. The charge consists primarily of management fees and additional expenses, such as fixed trading fees, legal fees, and the investment manager’s auditor and custody fees. The total expense ratio for the UKRF’s default investment funds varies depending on how far the member is from their target retirement date, as the mix of underlying assets changes.
- Transaction costs – For all funds, including the default investment funds, there are additional transaction costs paid by members. These arise when the investment managers trade within the funds and include commission, taxes, levies and the cost of stock lending. The level of transaction costs can vary depending on whether an investment fund is actively or passively managed. Transaction costs can also vary from year to year depending on the amount of transactional activity carried out by investment managers of each fund.
For the UKRF Lifestyle Fund ranges the table shows:
- The costs for the UKRF Lifestyle Mature Fund (where assets are invested if members do not access their retirement savings at their target date);
- The costs for each of the ten funds currently on the glide path (the UKRF Lifestyle 2025 – 2034 Funds); and
- The cost of the funds that have yet to enter the glide path (the UKRF Lifestyle 2035 – 2062 Funds).
The table also includes the costs for the UKRF Lifestyle (Closed) Mature Fund (where assets are invested if members do not access their retirement savings at their target date).
The Trustee followed statutory guidance when gathering data for the transaction costs for each default and self-select fund have been obtained for the reporting period. There is no transaction cost data missing for any of the UKRF’s investment options. Further information on each investment fund can be found in the individual fund factsheets, which can be accessed on ePA.
The UKRF Lifestyle Fund range (default)
| Fund |
Type of management* |
Total expense ratio for year to 30 September 2024 |
Transaction costs for year to 30 September 2024** |
Total costs for year to 30 September 2024 |
| FundUKRF Lifestyle Mature Fund |
Type of management*Active and passive |
Total expense ratio for year to 30 September 20240.21% |
Transaction costs for year to 30 September 2024**0.01% |
Total costs for year to 30 September 2020.22% |
| FundUKRF Lifestyle 2025 Fund |
Type of management*Active and passive |
Total expense ratio for year to 30 September 20240.21% |
Transaction costs for year to 30 September 2024**0.01% |
Total costs for year to 30 September 20240.22% |
| FundUKRF Lifestyle 2026 Fund |
Type of management*Active and passive |
Total expense ratio for year to 30 September 20240.22% |
Transaction costs for year to 30 September 2024**0.02% |
Total costs for year to 30 September 20240.24% |
| FundUKRF Lifestyle 2027 Fund |
Type of management*Active and passive |
Total expense ratio for year to 30 September 20240.23% |
Transaction costs for year to 30 September 2024**0.02% |
Total costs for year to 30 September 20240.25% |
| FundUKRF Lifestyle 2028 Fund |
Type of management*Active and passive |
Total expense ratio for year to 30 September 20240.24% |
Transaction costs for year to 30 September 2024**0.03% |
Total costs for year to 30 September 20240.27% |
| FundUKRF Lifestyle 2029 Fund |
Type of management*Active and passive |
Total expense ratio for year to 30 September 20240.25% |
Transaction costs for year to 30 September 2024**0.03% |
Total costs for year to 30 September 20240.28% |
| FundUKRF Lifestyle 2030 Fund |
Type of management*Active and passive |
Total expense ratio for year to 30 September 20240.26% |
Transaction costs for year to 30 September 2024**0.04% |
Total costs for year to 30 September 20240.30% |
| FundUKRF Lifestyle 2031 Fund |
Type of management*Active and passive |
Total expense ratio for year to 30 September 20240.27% |
Transaction costs for year to 30 September 2024**0.04% |
Total costs for year to 30 September 20240.31% |
| FundUKRF Lifestyle 2032 Fund |
Type of management*Active and passive |
Total expense ratio for year to 30 September 20240.28% |
Transaction costs for year to 30 September 2024**0.05% |
Total costs for year to 30 September 20240.33% |
| FundUKRF Lifestyle 2033 Fund |
Type of management*Active and passive |
Total expense ratio for year to 30 September 20240.28% |
Transaction costs for year to 30 September 2024**0.05% |
Total costs for year to 30 September 20240.33% |
| FundUKRF Lifestyle 2034 Fund |
Type of management*Active and passive |
Total expense ratio for year to 30 September 20240.28% |
Transaction costs for year to 30 September 2024**0.06% |
Total costs for year to 30 September 20240.34% |
| FundUKRF Lifestyle 2035 – 2062 Funds |
Type of management*Active and passive |
Total expense ratio for year to 30 September 20240.30% |
Transaction costs for year to 30 September 2024**0.06% |
Total costs for year to 30 September 20240.36% |
The UKRF Lifestyle (Closed) Fund range (default)
| Fund |
Type of management* |
Total expense ratio for year to 30 September 2024 |
Transaction costs for year to 30 September 2024** |
Total costs for year to 30 September 2024 |
| FundUKRF Lifestyle (Closed) Mature Fund |
Type of management*Active and passive |
Total expense ratio for year to 30 September 20240.13% |
Transaction costs for year to 30 September 2024**-0.05%** |
Total costs for year to 30 September 20240.08% |
Other DC investment options (self-select)
| Fund |
Type of management* |
Total expense ratio for year to 30 September 2024 |
Transaction costs for year to 30 September 2024** |
Total costs for year to 30 September 2024 |
| FundUKRF UK Equity Index Fund |
Type of management*Passive |
Total expense ratio for year to 30 September 20240.06% |
Transaction costs for year to 30 September 2024**0.02% |
Total costs for year to 30 September 20240.08% |
| FundUKRF Global (ex-UK) Equity Index Fund |
Type of management*Passive |
Total expense ratio for year to 30 September 20240.07% |
Transaction costs for year to 30 September 2024**<0.01% |
Total costs for year to 30 September 20240.07% |
| FundUKRF Emerging Markets Equity Index Fund |
Type of management*Passive |
Total expense ratio for year to 30 September 20240.19% |
Transaction costs for year to 30 September 2024**0.01% |
Total costs for year to 30 September 20240.20% |
| FundUKRF Sustainable Equity Fund |
Type of management*Active |
Total expense ratio for year to 30 September 20240.80% |
Transaction costs for year to 30 September 2024**<0.01% |
Total costs for year to 30 September 20240.80% |
| FundUKRF Diversified Growth Fund |
Type of management*Active |
Total expense ratio for year to 30 September 20240.30% |
Transaction costs for year to 30 September 2024*0.06% |
Total costs for year to 30 September 20240.36% |
| FundUKRF Sterling Corporate Bond Fund |
Type of management*Active |
Total expense ratio for year to 30 September 20240.26% |
Transaction costs for year to 30 September 2024**-0.01%** |
Total costs for year to 30 September 20240.25% |
| FundUKRF Over 15 Years UK Gilt Index Fund |
Type of management*Passive |
Total expense ratio for year to 30 September 20240.08% |
Transaction costs for year to 30 September 2024**-0.07%** |
Total costs for year to 30 September 20240.01% |
| FundUKRF Over 5 Years Index-Linked UK Gilt Index Fund |
Type of management*Passive |
Total expense ratio for year to 30 September 20240.08% |
Transaction costs for year to 30 September 2024**0.03% |
Total costs for year to 30 September 20240.11% |
| FundUKRF Mixed (Gilts, Cash and Growth) Fund |
Type of management*Active and passive |
Total expense ratio for year to 30 September 20240.15% |
Transaction costs for year to 30 September 2024**-0.03%** |
Total costs for year to 30 September 20240.12% |
| FundUKRF Cash Fund |
Type of management*Active |
Total expense ratio for year to 30 September 20240.13% |
Transaction costs for year to 30 September 2024**0.01% |
Total costs for year to 30 September 20240.14% |
* In a passively managed fund, the investment manager aims to match the return of a specific index. They do this by investing in assets that are broadly the same as those in the index. An active manager uses their expertise to select investments that they believe will perform better than an index over a period of time. As active funds require more time and involvement from the manager they tend to have higher costs than passive funds. The UKRF Lifestyle Fund ranges and the UKRF Mixed (Gilts, Cash and Growth) Fund invest in a mixture of actively and passively managed funds.
** The FCA has prescribed a methodology for calculating transaction costs known as ‘slippage’. This methodology captures explicit costs incurred when carrying out a transaction, such as taxes and broker commissions. It also captures implicit costs such as the change in the price of the asset being traded during the period the transaction is being carried out. This methodology can result in negative transaction costs where for example other market activity pushes the price of the asset being traded down, whilst the transaction was in progress, resulting in the asset being purchased for a lower price than when the trade was initiated.
External With-profit policies
| Fund |
Information on charges |
| FundAviva (ex Norwich Union) |
Information on chargesAviva has reported annual administration charges of 0.88% and total transaction costs of 0.039% (comprised of a “buying and selling” cost of 0.037% and a “lending and borrowing” cost of 0.002%) for Aviva With-profit (NU) Standard Series 01 Pension, as of 30 June 2024. |
| FundAviva (ex Friends Life) |
Information on chargesAviva has reported annual administration charges of 2.75% and total transaction costs of 0.028% (comprised of a “buying and selling” cost of 0.025% and a “lending and borrowing” cost of 0.003%) for the Aviva Secure Growth Fund (ex L&M) fund as of 30 June 2024. |
| FundPhoenix Life |
Information on chargesThe Trustee has requested this information from Phoenix Life, however Phoenix Life has been unable to provide this information as at the date this statement is signed. |
The providers of the With-profit policies have been unable to share cost data for the full reporting period. Therefore, the most up to date cost data available has been reported in the above table.
The charges deducted from the With-profit policies include the cost of administering the fund, whereas the Total Expense Ratio applied to the UKRF investment funds just refers to the investment costs.
Back to top
Effect of charges on members’ funds
The Trustee has provided illustrative examples of the cumulative effect over time of the charges and costs shown above on the value of a representative sample of members’ DC savings. In this section, we provide these illustrations for a range of investment funds and a range of different member DC pot sizes that are broadly comparable to the most common DC pot sizes currently found in the UKRF. The Trustee followed statutory guidance when preparing these illustrations and gathering data for the assumptions used.
It is important to note that these illustrations are designed to show the potential impact of costs and charges on retirement savings. The illustrations are not designed to provide members with a personalised projection of what their retirement savings may be worth at retirement. All illustrations assume a growth rate for each type of investment fund that is applied at the same rate for each year of the illustration. The value of investments and the returns they generate are not guaranteed and can go down as well as up and this risk to members’ retirement savings is not reflected in these illustrations.
The table below shows the assumed rates of growth used in the illustrations. These are the same headline assumed growth rates as used in the annual member benefit statements. The illustrations work by assuming the growth rates in the table are achieved each year, while the total expense ratio for the reporting period and the average transaction costs for the last five reporting periods are deducted each year. In reality the investment returns and costs and charges will fluctuate each year. For reference the table below also shows the actual returns achieved in the five years to 30 September 2024.
It should be noted that the assumed rates of growth are reviewed annually and, if necessary, are adjusted to reflect up to date market conditions.
| The UKRF investment funds for which illustrations have been provided |
Assumed rates of growth (per year) above inflation (assumed to be 2.5%) |
Actual returns for fund in five years to 30 September 2024 |
Average transaction costs (over the previous five years) |
The UKRF investment funds for which illustrations have been provided
UKRF Lifestyle Fund range
2035 – 2062 Funds
|
Assumed rates of growth (per year) above inflation (assumed to be 2.5%)
2.5% while the fund is more than 10 years from its maturity date.
|
Actual returns for fund in five years to 30 September 2024
2.8%
|
Average transaction costs(over the previous five years)
0.16%
|
The UKRF investment funds for which illustrations have been provided
UKRF Lifestyle Fund range glide path Funds
2025 – 2034
|
Assumed rates of growth (per year) above inflation (assumed to be 2.5%)
2.49% (2034 Fund)
2.13% (2025 Fund) depending on the fund invested in.
|
Actual returns for fund in five years to 30 September 2024
2025 Fund: -0.2%
2026 Fund: 0.2%
2027 Fund: 0.6%
2028 Fund: 1.0%
2029 Fund: 1.3%
2030 Fund: 1.7%
2031 Fund: 2.2%
2032 Fund: 2.4%
2033 Fund: 2.7%
2034 Fund: 2.8%
|
Average transaction costs(over the previous five years)
2025 Fund: 0.10%
2026 Fund: 0.11%
2027 Fund: 0.12%
2028 Fund: 0.13%
2029 Fund: 0.14%
2030 Fund: 0.14%
2031 Fund: 0.15%
2032 Fund: 0.16%
2033 Fund: 0.16%
2034 Fund: 0.16%
|
|
The UKRF investment funds for which illustrations have been provided
UKRF Lifestyle Mature Fund |
Assumed rates of growth (per year) above inflation (assumed to be 2.5%)
2.10%
|
Actual returns for fund in five years to 30 September 2024
-1.1%
|
Average transaction costs(over the previous five years)
0.08%
|
|
The UKRF investment funds for which illustrations have been provided
UKRF Lifestyle (Closed) Mature Fund
|
Assumed rates of growth (per year) above inflation (assumed to be 2.5%)
3.00%
|
Actual returns for fund in five years to 30 September 2024
-7.3%
|
Average transaction costs(over the previous five years)
0.01%
|
|
The UKRF investment funds for which illustrations have been provided
UKRF Global (ex-UK) Equity Index Fund
|
Assumed rates of growth (per year) above inflation (assumed to be 2.5%)
2.50%
|
Actual returns for fund in five years to 30 September 2024
11.7%
|
Average transaction costs(over the previous five years)
<0.01%
|
|
The UKRF investment funds for which illustrations have been provided
UKRF Sustainable Equity Fund
|
Assumed rates of growth (per year) above inflation (assumed to be 2.5%)
4.50%
|
Actual returns for fund in five years to 30 September 2024
10.0%
|
Average transaction costs(over the previous five years)
0.01%
|
The following notes on the illustrations should also be read:
- Projected pot sizes are shown in today’s terms and do not need to be reduced further for the effects of future inflation.
- The starting pot sizes of £1,500, £8,000 and £30,000 have been selected as they broadly reflect the 25th percentile, median and 75th percentile respectively based on membership demographics in 2023.
- Inflation is assumed to be 2.5% per year. The Trustee is aware that inflation has exceeded this over the course of the reporting period. However, the Trustee believes that retaining this long term inflation assumption continues to be the correct approach for these illustrations.
- Unless stated, each illustration assumes up to 40 years of membership to cover how long the youngest UKRF member has before reaching state pension age (assumed to be 68).
- No future contributions are accounted for in the illustrations.
- Values shown are estimates and not guaranteed.
- The starting date for the illustrations is 30 September 2024.
- The rates of growth used in the illustrations are calculated by reference to the Financial Reporting Council’s AS TM1 Statutory Money Purchase Illustrations.
- The illustrations are based on an average of the past 5 years’ transaction costs.
The illustrations are presented in two different ways:
- For the UKRF Lifestyle Funds the illustrations should be read based on the number of years until the member’s chosen fund reaches its target retirement date. This is because the underlying asset allocation in these funds changes over time (the ‘glide path’) and is reflected in the illustrations.
- For the self-select funds, the UKRF Lifestyle Mature Fund and the UKRF Lifestyle (Closed) Mature Fund there is no glide path and therefore the illustrations should be read based upon the number of years (from 30 September 2024) that a member expects to be invested in those funds.
Illustrations are provided for the UKRF investment funds that meet the criteria below. These are the funds that:
- Have the lowest cost;
- Have the highest cost; and
- Are part of the default investment range.
Illustrations for the open default investment fund
An illustration is provided for these funds as they are part of the default investment fund. Please note:
- If a member is invested in one of these funds then they are at least 10 years from the date at which they plan to access their retirement savings, therefore this illustration starts at 10 years to retirement.
- While a member is more than 10 years from their target retirement date, these funds invest in the UKRF DGF which aims to grow the value of their DC retirement savings over the long term. Then, during the 10 years leading up to their target retirement date, it steadily introduces gilts and cash investment allocations before they reach their target retirement date. This is known as the glide path and the illustrations include the effect of these changes to the underlying investments.
- If the member does not access their savings when their fund reaches its target date, their savings will be moved to the UKRF Lifestyle Mature Fund and they should review the relevant illustration to see the impact this would have on their retirement savings.
- As these are indicative illustrations members should choose the number of years that is closest to their actual target retirement date. For example, as the starting date for the illustration is 30 September 2024, if a member’s target retirement date was 2044, they should review the 20 year line of the illustration.
| Years from 30 Sept 2024 until Lifestyle Fund reaches its target |
Starting pot size £1,500 |
Starting pot size £8,000 |
Starting pot size £30,000 |
| Before charges |
After charges |
Before charges |
After charges |
Before charges |
After charges |
| Note on how to read this table: If a member has invested £1,500 in this fund, and reaches their target retirement date in ten years’ time, their fund could grow to £1,874 if no charges are applied but to £1,806 with charges applied. |
| Years from 30 Sept 2024 until Lifestyle Fund reaches its target1 |
Starting pot size of £1,500 - before charges£1,531 |
Starting pot size of £1,500 - after charges£1,527 |
Starting pot size of £8,000 - before charges£8,166 |
Starting pot size of £8,000 - after charges£8,141 |
Starting pot size of £30,000 - before charges£30,623 |
Starting pot size of £30,000 - after charges£30,530 |
| Years from 30 Sept 2024 until Lifestyle Fund reaches its target5 |
Starting pot size of £1,500 - before charges£1,669 |
Starting pot size of £1,500 - after charges£1,641 |
Starting pot size of £8,000 - before charges£8,900 |
Starting pot size of £8,000 - after charges£8,752 |
Starting pot size of £30,000 - before charges£33,377 |
Starting pot size of £30,000 - after charges£32,820 |
| Years from 30 Sept 2024 until Lifestyle Fund reaches its target10 |
Starting pot size of £1,500 - before charges£1,874 |
Starting pot size of £1,500 - after charges£1,806 |
Starting pot size of £8,000 - before charges£9,997 |
Starting pot size of £8,000 - after charges£9,631 |
Starting pot size of £30,000 - before charges£37,488 |
Starting pot size of £30,000 - after charges£36,117 |
| Years from 30 Sept 2024 until Lifestyle Fund reaches its target15 |
Starting pot size of £1,500 - before charges£2,114 |
Starting pot size of £1,500 - after charges£1,993 |
Starting pot size of £8,000 - before charges£11,277 |
Starting pot size of £8,000 - after charges£10,631 |
Starting pot size of £30,000 - before charges£42,288 |
Starting pot size of £30,000 - after charges£39,865 |
| Years from 30 Sept 2024 until Lifestyle Fund reaches its target20 |
Starting pot size of £1,500 - before charges£2,385 |
Starting pot size of £1,500 - after charges£2,200 |
Starting pot size of £8,000 - before charges£12,721 |
Starting pot size of £8,000 - after charges£11,734 |
Starting pot size of £30,000 - before charges£47,703 |
Starting pot size of £30,000 - after charges£44,003 |
| Years from 30 Sept 2024 until Lifestyle Fund reaches its target25 |
Starting pot size of £1,500 - before charges£2,691 |
Starting pot size of £1,500 - after charges£2,428 |
Starting pot size of £8,000 - before charges£14,350 |
Starting pot size of £8,000 - after charges£12,952 |
Starting pot size of £30,000 - before charges£53,811 |
Starting pot size of £30,000 - after charges£48,570 |
| Years from 30 Sept 2024 until Lifestyle Fund reaches its target30 |
Starting pot size of £1,500 - before charges£3,035 |
Starting pot size of £1,500 - after charges£2,681 |
Starting pot size of £8,000 - before charges£16,187 |
Starting pot size of £8,000 - after charges£14,296 |
Starting pot size of £30,000 - before charges£60,701 |
Starting pot size of £30,000 - after charges£53,611 |
| Years from 30 Sept 2024 until Lifestyle Fund reaches its target35 |
Starting pot size of £1,500 - before charges£3,424 |
Starting pot size of £1,500 - after charges£2,959 |
Starting pot size of £8,000 - before charges£18,260 |
Starting pot size of £8,000 - after charges£15,780 |
Starting pot size of £30,000 - before charges£68,474 |
Starting pot size of £30,000 - after charges£59,175 |
| Years from 30 Sept 2024 until Lifestyle Fund reaches its target40 |
Starting pot size of £1,500 - before charges£3,862 |
Starting pot size of £1,500 - after charges£3,266 |
Starting pot size of £8,000 - before charges£20,598 |
Starting pot size of £8,000 - after charges£17,418 |
Starting pot size of £30,000 - before charges£77,242 |
Starting pot size of £30,000 - after charges£65,316 |
It is important to note that these illustrations are designed to show the potential impact of costs and charges on investment returns. The illustrations are not designed to provide members with a personalised projection of what their benefits may be worth at retirement. All illustrations assume a growth rate for each type of investment fund that is applied at the same rate for each year of the illustration. The value of investments and the returns they generate are not guaranteed and can go down as well as up and this risk to members’ retirement savings is not reflected in these illustrations.
An illustration is provided for these funds as they are part of the default investment fund. Please note:
- If a member is invested in one of these funds, they are within 10 years of their target retirement date.
- During the 10 years leading up to their target retirement date, these funds steadily introduce gilts and cash investment allocations before they reach their target date. This is known as the glide path and the illustration below includes the effect of these changes to the underlying investments.
If the member does not access their savings when the fund reaches its target date, their savings will be moved to the UKRF Lifestyle Mature Fund and they should review the relevant illustration to see the impact this would have on their retirement savings.
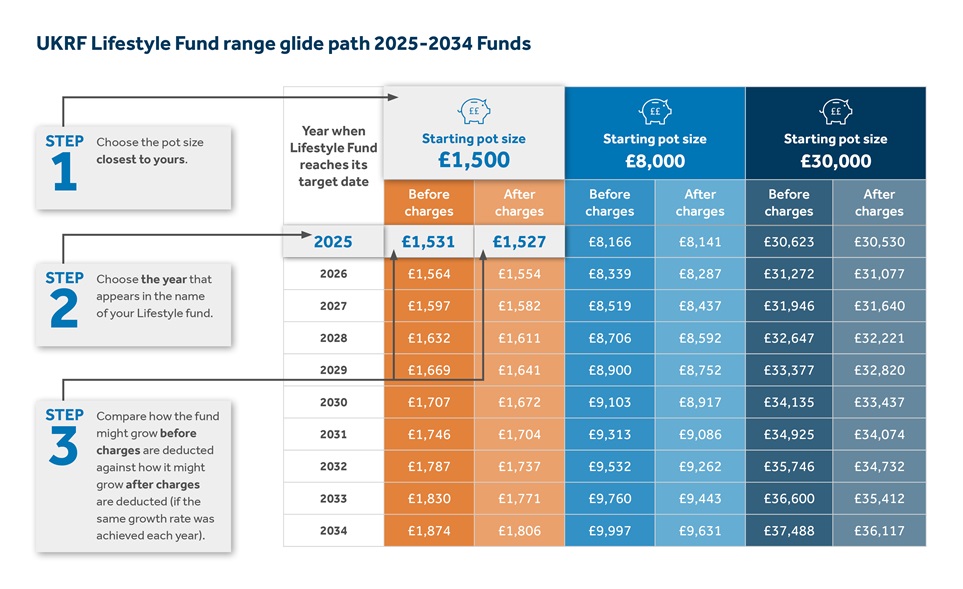
| Year when Lifestyle Fund reaches its target date |
Starting pot size £1,500 |
Starting pot size £8,000 |
Starting pot size £30,000 |
| Before charges |
After charges |
Before charges |
After charges |
Before charges |
After charges |
| Note on how to read this table: If a member has invested £1,500 in the UKRF Lifestyle 2025 Fund on 30 September 2024, the fund could grow at its target date (in 2025) to £1,531 if no charges are applied but to £1,527 with charges applied. |
| Year when Lifestyle Fund reaches its target date2025 |
Starting pot size £1,500 - before charges£1,531 |
Starting pot size £1,500 - after charges£1,527 |
Starting pot size £8,000 - before charges£8,166 |
Starting pot size £8,000 - after charges£8,141 |
Starting pot size £30,000 - before charges£30,623 |
Starting pot size £30,000 - after charges£30,530 |
| Year when Lifestyle Fund reaches its target date2026 |
Starting pot size £1,500 - before charges£1,564 |
Starting pot size £1,500 - after charges£1,554 |
Starting pot size £8,000 - before charges£8,339 |
Starting pot size £8,000 - after charges£8,287 |
Starting pot size £30,000 - before charges£31,272 |
Starting pot size £30,000 - after charges£31,077 |
| Year when Lifestyle Fund reaches its target date2027 |
Starting pot size £1,500 - before charges£1,597 |
Starting pot size £1,500 - after charges£1,582 |
Starting pot size £8,000 - before charges£8,519 |
Starting pot size £8,000 - after charges£8,437 |
Starting pot size £30,000 - before charges£31,946 |
Starting pot size £30,000 - after charges£31,640 |
| Year when Lifestyle Fund reaches its target date2028 |
Starting pot size £1,500 - before charges£1,632 |
Starting pot size £1,500 - after charges£1,611 |
Starting pot size £8,000 - before charges£8,706 |
Starting pot size £8,000 - after charges£8,592 |
Starting pot size £30,000 - before charges£32,647 |
Starting pot size £30,000 - after charges£32,221 |
| Year when Lifestyle Fund reaches its target date2029 |
Starting pot size £1,500 - before charges£1,669 |
Starting pot size £1,500 - after charges£1,641 |
Starting pot size £8,000 - before charges£8,900 |
Starting pot size £8,000 - after charges£8,752 |
Starting pot size £30,000 - before charges£33,377 |
Starting pot size £30,000 - after charges£32,820 |
| Year when Lifestyle Fund reaches its target date2030 |
Starting pot size £1,500 - before charges£1,707 |
Starting pot size £1,500 - after charges£1,672 |
Starting pot size £8,000 - before charges£9,103 |
Starting pot size £8,000 - after charges£8,917 |
Starting pot size £30,000 - before charges£34,135 |
Starting pot size £30,000 - after charges£33,437 |
| Year when Lifestyle Fund reaches its target date2031 |
Starting pot size £1,500 - before charges£1,746 |
Starting pot size £1,500 - after charges£1,704 |
Starting pot size £8,000 - before charges£9,313 |
Starting pot size £8,000 - after charges£9,086 |
Starting pot size £30,000 - before charges£34,925 |
Starting pot size £30,000 - after charges£34,074 |
| Year when Lifestyle Fund reaches its target date2032 |
Starting pot size £1,500 - before charges£1,787 |
Starting pot size £1,500 - after charges£1,737 |
Starting pot size £8,000 - before charges£9,532 |
Starting pot size £8,000 - after charges£9,262 |
Starting pot size £30,000 - before charges£35,746 |
Starting pot size £30,000 - after charges£34,732 |
| Year when Lifestyle Fund reaches its target date2033 |
Starting pot size £1,500 - before charges£1,830 |
Starting pot size £1,500 - after charges£1,771 |
Starting pot size £8,000 - before charges£9,760 |
Starting pot size £8,000 - after charges£9,443 |
Starting pot size £30,000 - before charges£36,600 |
Starting pot size £30,000 - after charges£35,412 |
| Year when Lifestyle Fund reaches its target date2034 |
Starting pot size £1,500 - before charges£1,874 |
Starting pot size £1,500 - after charges£1,806 |
Starting pot size £8,000 - before charges£9,997 |
Starting pot size £8,000 - after charges£9,631 |
Starting pot size £30,000 - before charges£37,488 |
Starting pot size £30,000 - after charges£36,117 |
It is important to note that these illustrations are designed to show the potential impact of costs and charges on investment returns. The illustrations are not designed to provide members with a personalised projection of what their benefits may be worth at retirement. All illustrations assume a growth rate for each type of investment fund that is applied at the same rate for each year of the illustration. The value of investments and the returns they generate are not guaranteed and can go down as well as up and this risk to members’ retirement savings is not reflected in these illustrations.
An illustration is provided for this fund as it is part of the default investment fund. A member’s savings will be invested here when their selected UKRF Lifestyle Fund reaches its target date which is usually around the time members expect to access their retirement savings. This illustration covers a maximum period of 15 years as this is not expected to be a long term investment option.
| Years of investment from 30 September 2024 |
Starting pot size £1,500 |
Starting pot size £8,000 |
Starting pot size £30,000 |
| Before charges |
After charges |
Before charges |
After charges |
Before charges |
After charges |
| Note on how to read this table: If a member has invested £1,500 in this fund on 30 September 2024 for one year, the fund value could grow to £1,531 if no charges are applied but would be £1,527 with charges applied. |
| Years of investment from 30 September 20241 |
Starting pot size £1,500 - before charges£1,531 |
Starting pot size £1,500 - after charges£1,527 |
Starting pot size £8,000 - before charges£8,164 |
Starting pot size £8,000 - after charges£8,141 |
Starting pot size £30,000 - before charges£30,615 |
Starting pot size £30,000 - after charges£30,530 |
| Years of investment from 30 September 20243 |
Starting pot size £1,500 - before charges£1,594 |
Starting pot size £1,500 - after charges£1,581 |
Starting pot size £8,000 - before charges£8,502 |
Starting pot size £8,000 - after charges£8,432 |
Starting pot size £30,000 - before charges£31,882 |
Starting pot size £30,000 - after charges£31,619 |
| Years of investment from 30 September 20245 |
Starting pot size £1,500 - before charges£1,660 |
Starting pot size £1,500 - after charges£1,637 |
Starting pot size £8,000 - before charges£8,854 |
Starting pot size £8,000 - after charges£8,732 |
Starting pot size £30,000 - before charges£33,202 |
Starting pot size £30,000 - after charges£32,747 |
| Years of investment from 30 September 202410 |
Starting pot size £1,500 - before charges£1,837 |
Starting pot size £1,500 - after charges£1,787 |
Starting pot size £8,000 - before charges£9,799 |
Starting pot size £8,000 - after charges£9,532 |
Starting pot size £30,000 - before charges£36,745 |
Starting pot size £30,000 - after charges£35,745 |
| Years of investment from 30 September 202415 |
Starting pot size £1,500 - before charges£2,033 |
Starting pot size £1,500 - after charges£1,951 |
Starting pot size £8,000 - before charges£10,844 |
Starting pot size £8,000 - after charges£10,405 |
Starting pot size £30,000 - before charges£40,667 |
Starting pot size £30,000 - after charges£39,017 |
It is important to note that these illustrations are designed to show the potential impact of costs and charges on investment returns. The illustrations are not designed to provide members with a personalised projection of what their benefits may be worth at retirement. All illustrations assume a growth rate for each type of investment fund that is applied at the same rate for each year of the illustration. The value of investments and the returns they generate are not guaranteed and can go down as well as up and this risk to members’ retirement savings is not reflected in these illustrations.
Illustrations for the closed default fund
An illustration is provided for this fund as it is part of the closed default investment fund. Members’ savings will be invested here when their UKRF Lifestyle (Closed) Fund reaches its target date which is usually around the time they expect to access their retirement savings. This illustration covers a maximum period of 15 years as this is not expected to be a long term investment option.
| Years of investment from 30 September 2024 |
Starting pot size £1,500 |
Starting pot size £8,000 |
Starting pot size £30,000 |
| Before charges |
After charges |
Before charges |
After charges |
Before charges |
After charges |
| Note on how to read this table: If a member has invested £1,500 in this fund on 30 September 2024 for one year, the fund could grow to £1,544 if no charges are applied but £1,542 with charges applied. |
| Years of investment from 30 September 20241 |
Starting pot size £1,500 - before charges£1,544 |
Starting pot size £1,500 - after charges£1,542 |
Starting pot size £8,000 - before charges£8,234 |
Starting pot size £8,000 - after charges£8,223 |
Starting pot size £30,000 - before charges£30,878 |
Starting pot size £30,000 - after charges£30,837 |
| Years of investment from 30 September 20243 |
Starting pot size £1,500 - before charges£1,636 |
Starting pot size £1,500 - after charges£1,629 |
Starting pot size £8,000 - before charges£8,723 |
Starting pot size £8,000 - after charges£8,689 |
Starting pot size £30,000 - before charges£32,712 |
Starting pot size £30,000 - after charges£32,583 |
| Years of investment from 30 September 20245 |
Starting pot size £1,500 - before charges£1,733 |
Starting pot size £1,500 - after charges£1,721 |
Starting pot size £8,000 - before charges£9,241 |
Starting pot size £8,000 - after charges£9,181 |
Starting pot size £30,000 - before charges£34,655 |
Starting pot size £30,000 - after charges£34,428 |
| Years of investment from 30 September 202410 |
Starting pot size £1,500 - before charges£2,002 |
Starting pot size £1,500 - after charges£1,975 |
Starting pot size £8,000 - before charges£10,675 |
Starting pot size £8,000 - after charges£10,536 |
Starting pot size £30,000 - before charges£40,032 |
Starting pot size £30,000 - after charges£39,508 |
| Years of investment from 30 September 202415 |
Starting pot size £1,500 - before charges£2,312 |
Starting pot size £1,500 - after charges£2,267 |
Starting pot size £8,000 - before charges£12,332 |
Starting pot size £8,000 - after charges£12,090 |
Starting pot size £30,000 - before charges£46,243 |
Starting pot size £30,000 - after charges£45,339 |
It is important to note that these illustrations are designed to show the potential impact of costs and charges on investment returns. The illustrations are not designed to provide members with a personalised projection of what their benefits may be worth at retirement. All illustrations assume a growth rate for each type of investment fund that is applied at the same rate for each year of the illustration. The value of investments and the returns they generate are not guaranteed and can go down as well as up and this risk to members’ retirement savings is not reflected in these illustrations.
Illustrations for the self-select funds
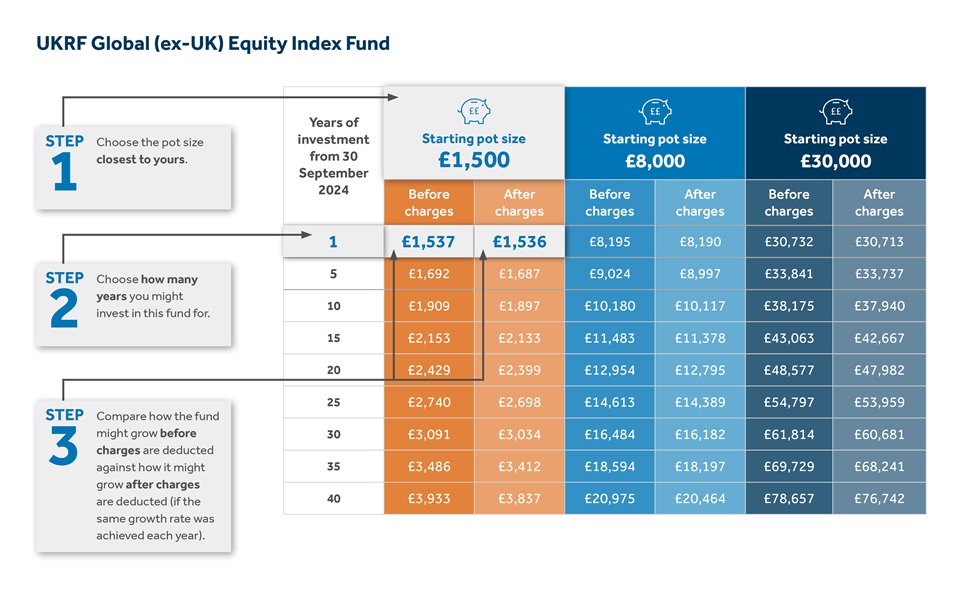
An illustration is provided for this fund as it is the self-select fund with the lowest charges.
| Years of investment from 30 September 2024 |
Starting pot size £1,500 |
Starting pot size £8,000 |
Starting pot size £30,000 |
| Before charges |
After charges |
Before charges |
After charges |
Before charges |
After charges |
| Note on how to read this table: If a member has invested £1,500 in this fund on 30 September 2024 for one year, their fund could grow to £1,537 if no charges are applied but to £1,536 with charges applied. |
| Years of investment from 30 September 20241 |
Starting pot size £1,500 - before charges£1,537 |
Starting pot size £1,500 - after charges£1,536 |
Starting pot size £8,000 - before charges£8,195 |
Starting pot size £8,000 - after charges£8,190 |
Starting pot size £30,000 - before charges£30,732 |
Starting pot size £30,000 - after charges£30,713 |
| Years of investment from 30 September 20245 |
Starting pot size £1,500 - before charges£1,692 |
Starting pot size £1,500 - after charges£1,687 |
Starting pot size £8,000 - before charges£9,024 |
Starting pot size £8,000 - after charges£8,997 |
Starting pot size £30,000 - before charges£33,841 |
Starting pot size £30,000 - after charges£33,737 |
| Years of investment from 30 September 202410 |
Starting pot size £1,500 - before charges£1,909 |
Starting pot size £1,500 - after charges£1,897 |
Starting pot size £8,000 - before charges£10,180 |
Starting pot size £7,000 - after charges£10,117 |
Starting pot size £30,000 - before charges£38,175 |
Starting pot size £30,000 - after charges£37,940 |
| Years of investment from 30 September 202415 |
Starting pot size £1,500 - before charges£2,153 |
Starting pot size £1,500 - after charges£2,133 |
Starting pot size £8,000 - before charges£11,483 |
Starting pot size £8,000 - after charges£11,378 |
Starting pot size £30,000 - before charges£43,063 |
Starting pot size £30,000 - after charges£42,667 |
| Years of investment from 30 September 202420 |
Starting pot size £1,500 - before charges£2,429 |
Starting pot size £1,500 - after charges£2,399 |
Starting pot size £8,000 - before charges£12,954 |
Starting pot size £8,000 - after charges£12,795 |
Starting pot size £30,000 - before charges£48,577 |
Starting pot size £30,000 - after charges£47,982 |
| Years of investment from 30 September 202425 |
Starting pot size £1,500 - before charges£2,740 |
Starting pot size £1,500 - after charges£2,698 |
Starting pot size £8,000 - before charges£14,613 |
Starting pot size £8,000 - after charges£14,389 |
Starting pot size £30,000 - before charges£54,797 |
Starting pot size £30,000 - after charges£53,959 |
| Years of investment from 30 September 202430 |
Starting pot size £1,500 - before charges£3,091 |
Starting pot size £1,500 - after charges£3,034 |
Starting pot size £8,000 - before charges£16,484 |
Starting pot size £8,000 - after charges£16,182 |
Starting pot size £30,000 - before charges£61,814 |
Starting pot size £30,000 - after charges£60,681 |
| Years of investment from 30 September 202435 |
Starting pot size £1,500 - before charges£3,486 |
Starting pot size £1,500 - after charges£3,412 |
Starting pot size £8,000 - before charges£18,594 |
Starting pot size £8,000 - after charges£18,197 |
Starting pot size £30,000 - before charges£69,729 |
Starting pot size £30,000 - after charges£68,241 |
| Years of investment from 30 September 202440 |
Starting pot size £1,500 - before charges£3,933 |
Starting pot size £1,500 - after charges£3,837 |
Starting pot size £8,000 - before charges£20,975 |
Starting pot size £8,000 - after charges£20,464 |
Starting pot size £30,000 - before charges£78,657 |
Starting pot size £30,000 - after charges£76,742 |
It is important to note that these illustrations are designed to show the potential impact of costs and charges on investment returns. The illustrations are not designed to provide members with a personalised projection of what their benefits may be worth at retirement. All illustrations assume a growth rate for each type of investment fund that is applied at the same rate for each year of the illustration. The value of investments and the returns they generate are not guaranteed and can go down as well as up and this risk to members’ retirement savings is not reflected in these illustrations.
An illustration is provided for this fund as it is the self-select fund with the highest level of charges.
| Years of investment from 30 September 2024 |
Starting pot size £1,500 |
Starting pot size £8,000 |
Starting pot size £30,000 |
| Before charges |
After charges |
Before charges |
After charges |
Before charges |
After charges |
| Note on how to read this table: If a member has invested £1,500 in this fund on 30 September 2024 for one year, their fund could grow to £1,566 if no charges are applied but to £1,554 with charges applied. |
| Years of investment from 30 September 20241 |
Starting pot size £1,500 - before charges£1,566 |
Starting pot size £1,500 - after charges£1,554 |
Starting pot size £8,000 - before charges£8,351 |
Starting pot size £8,000 - after charges£8,288 |
Starting pot size £30,000 - before charges£31,317 |
Starting pot size £30,000 - after charges£31,080 |
| Years of investment from 30 September 20245 |
Starting pot size £1,500 - before charges£1,859 |
Starting pot size £1,500 - after charges£1,790 |
Starting pot size £8,000 - before charges£9,917 |
Starting pot size £8,000 - after charges£9,547 |
Starting pot size £30,000 - before charges£37,190 |
Starting pot size £30,000 - after charges£35,802 |
| Years of investment from 30 September 202410 |
Starting pot size £1,500 - before charges£2,305 |
Starting pot size £1,500 - after charges£2,136 |
Starting pot size £8,000 - before charges£12,294 |
Starting pot size £8,000 - after charges£11,393 |
Starting pot size £30,000 - before charges£46,102 |
Starting pot size £30,000 - after charges£42,725 |
| Years of investment from 30 September 202415 |
Starting pot size £1,500 - before charges£2,858 |
Starting pot size £1,500 - after charges£2,549 |
Starting pot size £8,000 - before charges£15,240 |
Starting pot size £8,000 - after charges£13,597 |
Starting pot size £30,000 - before charges£57,150 |
Starting pot size £30,000 - after charges£50,988 |
| Years of investment from 30 September 202420 |
Starting pot size £1,500 - before charges£3,542 |
Starting pot size £1,500 - after charges£3,042 |
Starting pot size £8,000 - before charges£18,892 |
Starting pot size £8,000 - after charges£16,226 |
Starting pot size £30,000 - before charges£70,847 |
Starting pot size £30,000 - after charges£60,849 |
| Years of investment from 30 September 202425 |
Starting pot size £1,500 - before charges£4,391 |
Starting pot size £1,500 - after charges£3,631 |
Starting pot size £8,000 - before charges£23,420 |
Starting pot size £8,000 - after charges£19,364 |
Starting pot size £30,000 - before charges£87,825 |
Starting pot size £30,000 - after charges£72,616 |
| Years of investment from 30 September 202430 |
Starting pot size £1,500 - before charges£5,444 |
Starting pot size £1,500 - after charges£4,333 |
Starting pot size £8,000 - before charges£29,033 |
Starting pot size £8,000 - after charges£23,109 |
Starting pot size £30,000 - before charges£108,873 |
Starting pot size £30,000 - after charges£86,659 |
| Years of investment from 30 September 202435 |
Starting pot size £1,500 - before charges£6,748 |
Starting pot size £1,500 - after charges£5,171 |
Starting pot size £8,000 - before charges£35,990 |
Starting pot size £8,000 - after charges£27,578 |
Starting pot size £30,000 - before charges£134,964 |
Starting pot size £30,000 - after charges£103,418 |
| Years of investment from 30 September 202440 |
Starting pot size £1,500 - before charges£8,365 |
Starting pot size £1,500 - after charges£6,171 |
Starting pot size £8,000 - before charges£44,616 |
Starting pot size £8,000 - after charges£32,912 |
Starting pot size £30,000 - before charges£167,308 |
Starting pot size £30,000 - after charges£123,419 |
It is important to note that these illustrations are designed to show the potential impact of costs and charges on investment returns. The illustrations are not designed to provide members with a personalised projection of what their benefits may be worth at retirement. All illustrations assume a growth rate for each type of investment fund that is applied at the same rate for each year of the illustration. The value of investments and the returns they generate are not guaranteed and can go down as well as up and this risk to members’ retirement savings is not reflected in these illustrations.
Additional information on the pot sizes used in the illustrations
For many members, the DC section of the UKRF is a top-up to benefits they have built up in either the final salary section or in the cash balance section (called ‘Afterwork’). The pot sizes used in the above illustrations reflect the comparatively small size of DC benefits compared to the final salary and cash balance benefits. The pots have been calculated with reference to each element of DC benefits within the UKRF, such as the Retirement Investment Scheme (RIS). The RIS has a large number of members with small DC pots (this is a historic section with no active members where members tended to save small amounts for a short period of time).
The pot sizes used for the illustrations are detailed in the guidance to the illustrations above. By way of comparison, active members of Afterwork have an average DC pot size of £27,826, but an average cash balance fund value of £70,000 which demonstrates how the DC section tends to be a top-up to other benefits in the UKRF. The illustrations shown do not include the cash balance section.
Back to top
Net investment returns and asset allocation
The table below provides the annualised returns net of transaction costs and charges of all of the investment options members were able to select during the reporting period. This includes each of the funds that make up the default investment range and each of the self-select options available to members during the reporting period. The table also includes details of the assets under management for each fund. A single combined assets under management value is included for the range of default investment funds that members less than 10 years from retirement will invest in.
The UKRF Lifestyle Fund range (default)
| Investment options |
1 year net return % to 30 September 2024 |
3 year net return % to 30 September 2024 (p.a.) |
5 year net return % to 30 September 2024 (p.a.) |
Assets invested (£m) at 30 September 2024 |
| Fund |
Benchmark |
Fund |
Benchmark |
Fund |
Benchmark |
|
| Investment optionsUKRF Lifestyle Mature Fund |
1 year net return % to 30 September 2024 - Fund13.6 |
1 year net return % to 30 September 2024 - BenchmarkN/A |
3 year net return % to 30 September 2024 (p.a.) - Fund-3.6 |
3 year net return % to 30 September 2024 (p.a.) - BenchmarkN/A |
5 year net return % to 30 September 2024 (p.a.) - Fund-1.1 |
5 year net return % to 30 September 2024 (p.a.) - BenchmarkN/A |
Assets invested (£m) at 30 September 202491 |
| Investment optionsUKRF Lifestyle 2025 Fund |
1 year net return % to 30 September 2024- Fund14.0 |
1 year net return % to 30 September 2024- BenchmarkN/A |
3 year net return % to 30 September 2024 (p.a.) - Fund-3.2 |
3 year net return % to 30 September 2024 (p.a.) - BenchmarkN/A |
5 year net return % to 30 September 2024 (p.a.) - Fund-0.2 |
5 year net return % to 30 September 2024 (p.a.) - BenchmarkN/A |
Assets invested (£m) at 30 September 2024694 |
| Investment optionsUKRF Lifestyle 2026 Fund |
1 year net return % to 30 September 2024 - Fund14.8 |
1 year net return % to 30 September 2024 - BenchmarkN/A |
3 year net return % to 30 September 2024 (p.a.) - Fund-2.8 |
3 year net return % to 30 September 2024 (p.a.) - BenchmarkN/A |
5 year net return % to 30 September 2024 (p.a.) - Fund0.2 |
5 year net return % to 30 September 2024 (p.a.) - BenchmarkN/A |
| Investment optionsUKRF Lifestyle 2027 Fund |
1 year net return % to 30 September 2024 - Fund15.4 |
1 year net return % to 30 September 2024 - BenchmarkN/A |
3 year net return % to 30 September 2024 (p.a.) - Fund-2.5 |
3 year net return % to 30 September 2024 (p.a.) - BenchmarkN/A |
5 year net return % to 30 September 2024 (p.a.) - Fund0.6 |
5 year net return % to 30 September 2024 (p.a.) - BenchmarkN/A |
| Investment optionsUKRF Lifestyle 2028 Fund |
1 year net return % to 30 September 2024 - Fund15.8 |
1 year net return % to 30 September 2024 - BenchmarkN/A |
3 year net return % to 30 September 2024 (p.a.) - Fund-2.2 |
3 year net return % to 30 September 2024 (p.a.) - BenchmarkN/A |
5 year net return % to 30 September 2024 (p.a.) - Fund1.0 |
5 year net return % to 30 September 2024 (p.a.) - BenchmarkN/A |
| Investment optionsUKRF Lifestyle 2029 Fund |
1 year net return % to 30 September 2024 - Fund16.4 |
1 year net return % to 30 September 2024 - BenchmarkN/A |
3 year net return % to 30 September 2024 (p.a.) - Fund-2.0 |
3 year net return % to 30 September 2024 (p.a.) - BenchmarkN/A |
5 year net return % to 30 September 2024 (p.a.) - Fund1.3 |
5 year net return % to 30 September 2024 (p.a.) - BenchmarkN/A |
| Investment optionsUKRF Lifestyle 2030 Fund |
1 year net return % to 30 September 2024 - Fund17.4 |
1 year net return % to 30 September 2024 - BenchmarkN/A |
3 year net return % to 30 September 2024 (p.a.) - Fund-1.5 |
3 year net return % to 30 September 2024 (p.a.) - BenchmarkN/A |
5 year net return % to 30 September 2024 (p.a.) - Fund1.7 |
5 year net return % to 30 September 2024 (p.a.) - BenchmarkN/A |
| Investment optionsUKRF Lifestyle 2031 Fund |
1 year net return % to 30 September 2024 - Fund18.3 |
1 year net return % to 30 September 2024 - BenchmarkN/A |
3 year net return % to 30 September 2024 (p.a.) - Fund-1.1 |
3 year net return % to 30 September 2024 (p.a.) - BenchmarkN/A |
5 year net return % to 30 September 2024 (p.a.) - Fund2.2 |
5 year net return % to 30 September 2024 (p.a.) - BenchmarkN/A |
| Investment optionsUKRF Lifestyle 2032 Fund |
1 year net return % to 30 September 2024 - Fund18.9 |
1 year net return % to 30 September 2024 - BenchmarkN/A |
3 year net return % to 30 September 2024 (p.a.) - Fund-0.8 |
3 year net return % to 30 September 2024 (p.a.) - BenchmarkN/A |
5 year net return % to 30 September 2024 (p.a.) - Fund2.4 |
5 year net return % to 30 September 2024 (p.a.) - BenchmarkN/A |
| Investment optionsUKRF Lifestyle 2033 Fund |
1 year net return % to 30 September 2024 - Fund19.6 |
1 year net return % to 30 September 2024 - BenchmarkN/A |
3 year net return % to 30 September 2024 (p.a.) - Fund-0.4 |
3 year net return % to 30 September 2024 (p.a.) - BenchmarkN/A |
5 year net return % to 30 September 2024 (p.a.) - Fund2.7 |
5 year net return % to 30 September 2024 (p.a.) - BenchmarkN/A |
| Investment optionsUKRF Lifestyle 2034 Fund |
1 year net return % to 30 September 2024 - Fund20.3 |
1 year net return % to 30 September 2024 - BenchmarkN/A |
3 year net return % to 30 September 2024 (p.a.) - Fund-0.2 |
3 year net return % to 30 September 2024 (p.a.) - BenchmarkN/A |
5 year net return % to 30 September 2024 (p.a.) - Fund2.8 |
5 year net return % to 30 September 2024 (p.a.) - BenchmarkN/A |
| Investment optionsUKRF Lifestyle 2035 – 2062 Funds |
1 year net return % to 30 September 2024 - Fund20.5 |
1 year net return % to 30 September 2024 - BenchmarkN/A |
3 year net return % to 30 September 2024 (p.a.) - Fund-0.2 |
3 year net return % to 30 September 2024 (p.a.) - BenchmarkN/A |
5 year net return % to 30 September 2024 (p.a.) - Fund2.8 |
5 year net return % to 30 September 2024 (p.a.) - BenchmarkN/A |
Assets invested (£m) at 30 September 2024602 |
The UKRF Lifestyle (Closed) Fund range (default)
| Investment options |
1 year net return % to 30 September 2024 |
3 year net return % to 30 September 2024 (p.a.) |
5 year net return % to 30 September 2024 (p.a.) |
Assets invested (£m) at 30 September 2024 |
| Fund |
Benchmark |
Fund |
Benchmark |
Fund |
Benchmark |
|
| Investment optionsUKRF Lifestyle (Closed) Mature Fund |
1 year net return % to 30 September 2024 - Fund8.9 |
1 year net return % to 30 September 2024 - BenchmarkN/A |
3 year net return % to 30 September 2024 (p.a.) - Fund-10.5 |
3 year net return % to 30 September 2024 (p.a.) - BenchmarkN/A |
5 year net return % to 30 September 2024 (p.a.) - Fund-7.3 |
5 year net return % to 30 September 2024 (p.a.) - BenchmarkN/A |
Assets invested (£m) at 30 September 202431 |
Other DC investment options (self-select)
| Investment options |
1 year net return % to 30 September 2024 |
3 year net return % to 30 September 2024 (p.a.) |
5 year net return % to 30 September 2024 (p.a.) |
Assets invested (£m) at 30 September 2024 |
| Fund |
Benchmark |
Fund |
Benchmark |
Fund |
Benchmark |
|
| Investment optionsUKRF UK Equity Index Fund |
1 year net return % to 30 September 2024 - Fund13.3 |
1 year net return % to 30 September 2024 - Benchmark13.4 |
3 year net return % to 30 September 2024 (p.a.) - Fund7.4 |
3 year net return % to 30 September 2024 (p.a.) - Benchmark7.4 |
5 year net return % to 30 September 2024 (p.a.) - Fund5.8 |
5 year net return % to 30 September 2024 (p.a.) - Benchmark5.7 |
Assets invested (£m) at 30 September 2024113 |
| Investment optionsUKRF Global (ex-UK) Equity Index Fund |
1 year net return % to 30 September 2024 - Fund20.9 |
1 year net return % to 30 September 2024 - Benchmark20.8 |
3 year net return % to 30 September 2024 (p.a.) - Fund9.4 |
3 year net return % to 30 September 2024 (p.a.) - Benchmark9.2 |
5 year net return % to 30 September 2024 (p.a.) - Fund11.7 |
5 year net return % to 30 September 2024 (p.a.) - Benchmark11.5 |
Assets invested (£m) at 30 September 2024403 |
| Investment optionsUKRF Emerging Markets Equity Index Fund |
1 year net return % to 30 September 2024 - Fund14.3 |
1 year net return % to 30 September 2024 - Benchmark14.7 |
3 year net return % to 30 September 2024 (p.a.) - Fund0.2 |
3 year net return % to 30 September 2024 (p.a.) - Benchmark0.6 |
5 year net return % to 30 September 2024 (p.a.) - Fund3.8 |
5 year net return % to 30 September 2024 (p.a.) - Benchmark4.0 |
Assets invested (£m) at 30 September 202429 |
| Investment optionsUKRF Sustainable Equity Fund |
1 year net return % to 30 September 2024 - Fund19.5 |
1 year net return % to 30 September 2024 - Benchmark19.9 |
3 year net return % to 30 September 2024 (p.a.) - Fund4.3 |
3 year net return % to 30 September 2024 (p.a.) - Benchmark5.9 |
5 year net return % to 30 September 2024 (p.a.) - Fund10.0 |
5 year net return % to 30 September 2024 (p.a.) - Benchmark20.8 |
Assets invested (£m) at 30 September 202433 |
| Investment optionsUKRF Diversified Growth Fund |
1 year net return % to 30 September 2024 - Fund20.5 |
1 year net return % to 30 September 2024 - BenchmarkN/A |
3 year net return % to 30 September 2024 (p.a.) - Fund-0.2 |
3 year net return % to 30 September 2024 (p.a.) - BenchmarkN/A |
5 year net return % to 30 September 2024 (p.a.) - Fund2.8 |
5 year net return % to 30 September 2024 (p.a.) - BenchmarkN/A |
Assets invested (£m) at 30 September 202484 |
| Investment optionsUKRF Sterling Corporate Bond Fund |
1 year net return % to 30 September 2024 - Fund10.6 |
1 year net return % to 30 September 2024 - Benchmark9.7 |
3 year net return % to 30 September 2024 (p.a.) - Fund-2.9 |
3 year net return % to 30 September 2024 (p.a.) - Benchmark-2.9 |
5 year net return % to 30 September 2024 (p.a.) - Fund-0.8 |
5 year net return % to 30 September 2024 (p.a.) - Benchmark-1.1 |
Assets invested (£m) at 30 September 20247 |
| Investment optionsUKRF Over 15 Years UK Gilt Index Fund |
1 year net return % to 30 September 2024 - Fund10.2 |
1 year net return % to 30 September 2024 - Benchmark10.1 |
3 year net return % to 30 September 2024 (p.a.) - Fund-14.7 |
3 year net return % to 30 September 2024 (p.a.) - Benchmark-14.8 |
5 year net return % to 30 September 2024 (p.a.) - Fund-10.3 |
5 year net return % to 30 September 2024 (p.a.) - Benchmark-10.4 |
Assets invested (£m) at 30 September 20247 |
| Investment optionsUKRF Over 5 Years Index-Linked UK Gilt Index Fund |
1 year net return % to 30 September 2024 - Fund6.5 |
1 year net return % to 30 September 2024 - Benchmark6.4 |
3 year net return % to 30 September 2024 (p.a.) - Fund-14.2 |
3 year net return % to 30 September 2024 (p.a.) - Benchmark-14.3 |
5 year net return % to 30 September 2024 (p.a.) - Fund-8.6 |
5 year net return % to 30 September 2024 (p.a.) - Benchmark-8.7 |
Assets invested (£m) at 30 September 20249 |
| Investment optionsUKRF Mixed (Gilts, Cash and Growth) Fund |
1 year net return % to 30 September 2024 - Fund10.6 |
1 year net return % to 30 September 2024 - BenchmarkN/A |
3 year net return % to 30 September 2024 (p.a.) - Fund-8.9 |
3 year net return % to 30 September 2024 (p.a.) - BenchmarkN/A |
5 year net return % to 30 September 2024 (p.a.) - Fund-5.7 |
5 year net return % to 30 September 2024 (p.a.) - BenchmarkN/A |
Assets invested (£m) at 30 September 202436 |
| Investment optionsUKRF Cash Fund |
1 year net return % to 30 September 2024 - Fund5.3 |
1 year net return % to 30 September 2024 - Benchmark5.3 |
3 year net return % to 30 September 2024 (p.a.) - Fund3.3 |
3 year net return % to 30 September 2024 (p.a.) - Benchmark3.3 |
5 year net return % to 30 September 2024 (p.a.) - Fund2.1 |
5 year net return % to 30 September 2024 (p.a.) - Benchmark2.0 |
Assets invested (£m) at 30 September 202428 |
A benchmark is not provided for the UKRF Lifestyle Funds, UKRF Mixed (Cash, Gilts and Growth) Fund or UKRF Diversified Growth Fund.
For investment strategies where the investment returns vary with age, the Trustee is required to show the returns for a member aged 25, 45, and 55 at the start of the reporting period. This can be determined by looking at the relevant UKRF Lifestyle Funds as set out above.
Some UKRF members have benefits invested in external ‘With-profit’ policies. The table below outlines the information shared by the providers of these policies, regarding the net investment returns for members invested in these arrangements.
Aviva (ex Norwich Union) – as at 30 June 2024
| Fund Option |
1 year net return % |
5 year net return % (p.a.) |
| Fund OptionAviva With-profit (NU) Standard Series 01 |
1 year net return %1.4 |
5 year net return % (p.a.)2.6 |
Aviva (ex Friends Life) – as at 30 September 2024
| Fund Option |
1 year net return % |
5 year net return % (p.a.) |
| Fund OptionAv Secure Growth Fund (ex L&M) |
1 year net return %4.6 |
5 year net return % (p.a.)4.1 |
Phoenix Life
| Fund Option |
1 year net return % |
5 year net return % (p.a.) |
| Fund OptionPhoenix Life |
1 year net return %Not provided |
5 year net return % (p.a.)Not provided |
With-profit funds work in a different way to the other funds available through the UKRF. Savings in these funds are invested in a pool with other investors and participate in the performance of the With-profit fund. Investment returns are ‘smoothed’, meaning that in years of high fund performance some profits (or returns) are held back with the aim that a return can continue to be paid in times of adverse investment conditions. Returns under With-profit funds are normally passed on through the application of bonuses, and these come in the form of ‘Regular’ and ‘Final’ bonuses which vary depending on the performance of the underlying assets. The figures in the table above show the returns achieved (after charges) by the underlying assets held by each With-profit fund. The actual returns received will be different to the figures quoted above as they depend on factors that can vary by individual investors e.g., the value of bonuses and any market value reductions applied.
Asset allocation of the default investment funds
The table below provides a summary of the assets held by the UKRF Lifestyle Fund ranges (the default investment funds) over the reporting period.
The UKRF Lifestyle Fund range (default)
| Investment Options |
Listed Equities |
Bonds |
Cash |
Property/ Real Estate |
Other |
Total |
| Investment OptionsUKRF Lifestyle Mature Fund |
Listed Equities23.6% |
Bonds43.5% |
Cash25.0% |
Property/ Real Estate6.1% |
Other1.8% |
Total100.0% |
| Investment OptionsUKRF Lifestyle 2025 Fund |
Listed Equities25.8% |
Bonds42.5% |
Cash23.1% |
Property/ Real Estate6.7% |
Other1.9% |
Total100.0% |
| Investment OptionsUKRF Lifestyle 2026 Fund |
Listed Equities28.6% |
Bonds41.1% |
Cash20.6% |
Property/ Real Estate7.5% |
Other2.1% |
Total100.0% |
| Investment OptionsUKRF Lifestyle 2027 Fund |
Listed Equities31.5% |
Bonds39.8% |
Cash18.1% |
Property/ Real Estate8.2% |
Other2.4% |
Total100.0% |
| Investment OptionsUKRF Lifestyle 2028 Fund |
Listed Equities34.4% |
Bonds38.4% |
Cash15.6% |
Property/ Real Estate9.0% |
Other2.6% |
Total100.0% |
| Investment OptionsUKRF Lifestyle 2029 Fund |
Listed Equities37.3% |
Bonds37.1% |
Cash13.1% |
Property/ Real Estate9.7% |
Other2.8% |
Total100.0% |
| Investment OptionsUKRF Lifestyle 2030 Fund |
Listed Equities40.2% |
Bonds35.7% |
Cash10.6% |
Property/ Real Estate10.5% |
Other3.0% |
Total100.0% |
| Investment OptionsUKRF Lifestyle 2031 Fund |
Listed Equities43.1% |
Bonds34.4% |
Cash8.1% |
Property/ Real Estate11.2% |
Other3.2% |
Total100.0% |
| Investment OptionsUKRF Lifestyle 2032 Fund |
Listed Equities45.9% |
Bonds33.0% |
Cash5.6% |
Property/ Real Estate12.0% |
Other3.4% |
Total100.0% |
| Investment OptionsUKRF Lifestyle 2033 Fund |
Listed Equities48.8% |
Bonds31.7% |
Cash3.1% |
Property/ Real Estate12.7% |
Other3.7% |
Total100.0% |
| Investment OptionsUKRF Lifestyle 2034 Fund |
Listed Equities51.4% |
Bonds30.5% |
Cash0.9% |
Property/ Real Estate13.4% |
Other3.8% |
Total100.0% |
| Investment OptionsUKRF Lifestyle 2035 – 2062 Funds |
Listed Equities52.4% |
Bonds30.0% |
Cash0.0% |
Property/ Real Estate13.7% |
Other3.9% |
Total100.0% |
The UKRF Lifestyle (Closed) Fund range (default)
| Investment Options |
Listed Equities |
Bonds |
Cash |
Property/ Real Estate |
Other |
Total |
| Investment OptionsUKRF Lifestyle (Closed) Mature Fund |
Listed Equities0% |
Bonds75.0% |
Cash25.0% |
Property/ Real Estate0% |
Other0% |
Total100.0% |
Note: all figures have been rounded to sum 100% and may not therefore be exact.
Back to top
How to read the illustration tables
It is important to note that the illustration tables are designed to show the potential impact of costs and charges on investment returns. All of the illustrations assume a growth rate for each type of investment fund that is applied at the same rate for each year of the illustration. In reality the value of investments and the returns they generate are not guaranteed and can go down as well as up and this risk to members' retirement savings is not reflected in these illustrations.
The illustrations also assume the investment charges and transaction costs remain the same and are deducted each year. In reality the costs and charges will fluctuate each year.
The illustrations are not designed to provide UKRF members with a personalised projection of what their benefits may be worth at retirement. DC members of the UKRF should review their latest benefit statement which is available on the member pages of ePA.
The diagrams below show you how to read the tables.
It is important to note that these illustrations are designed to show the potential impact of costs and charges on investment returns. The illustrations are not designed to provide members with a personalised projection of what their benefits may be worth at retirement. All illustrations assume a growth rate for each type of investment fund that is applied at the same rate for each year of the illustration. The value of investments and the returns they generate are not guaranteed and can go down as well as up and this risk to members’ retirement savings is not reflected in these illustrations.
Back to top
More information on the DC investment funds available for UKRF members
Where are the UKRF’s DC funds invested?
The UKRF’s DC investment funds invest in underlying pooled or collective investment funds provided by investment managers. If members would like further information on the underlying investment funds that the UKRF DC funds invest in, they are able to request it from the Barclays Team. They will be able to provide members with the International Securities Identification Numbers (these are unique to each individual fund) of the funds that members are invested in.
Where can members find more information on the performance of the DC investment funds?
For the latest performance figures for each fund members should go to the Investment Performance section under Investment Information on the member pages of ePA. Past performance is not a guide to future performance and members should refer to the relevant factsheets for more information on the objectives of the funds.
Where can I find more information on the Trustee’s investment responsibilities?
The Trustee has prepared a Statement of Investment Principles which includes the Trustee's investment responsibilities, its investment strategy and approach to risk management, and how the default funds are designed and governed.
For further information, members should read Your DC Investment Guide.
Back to top